
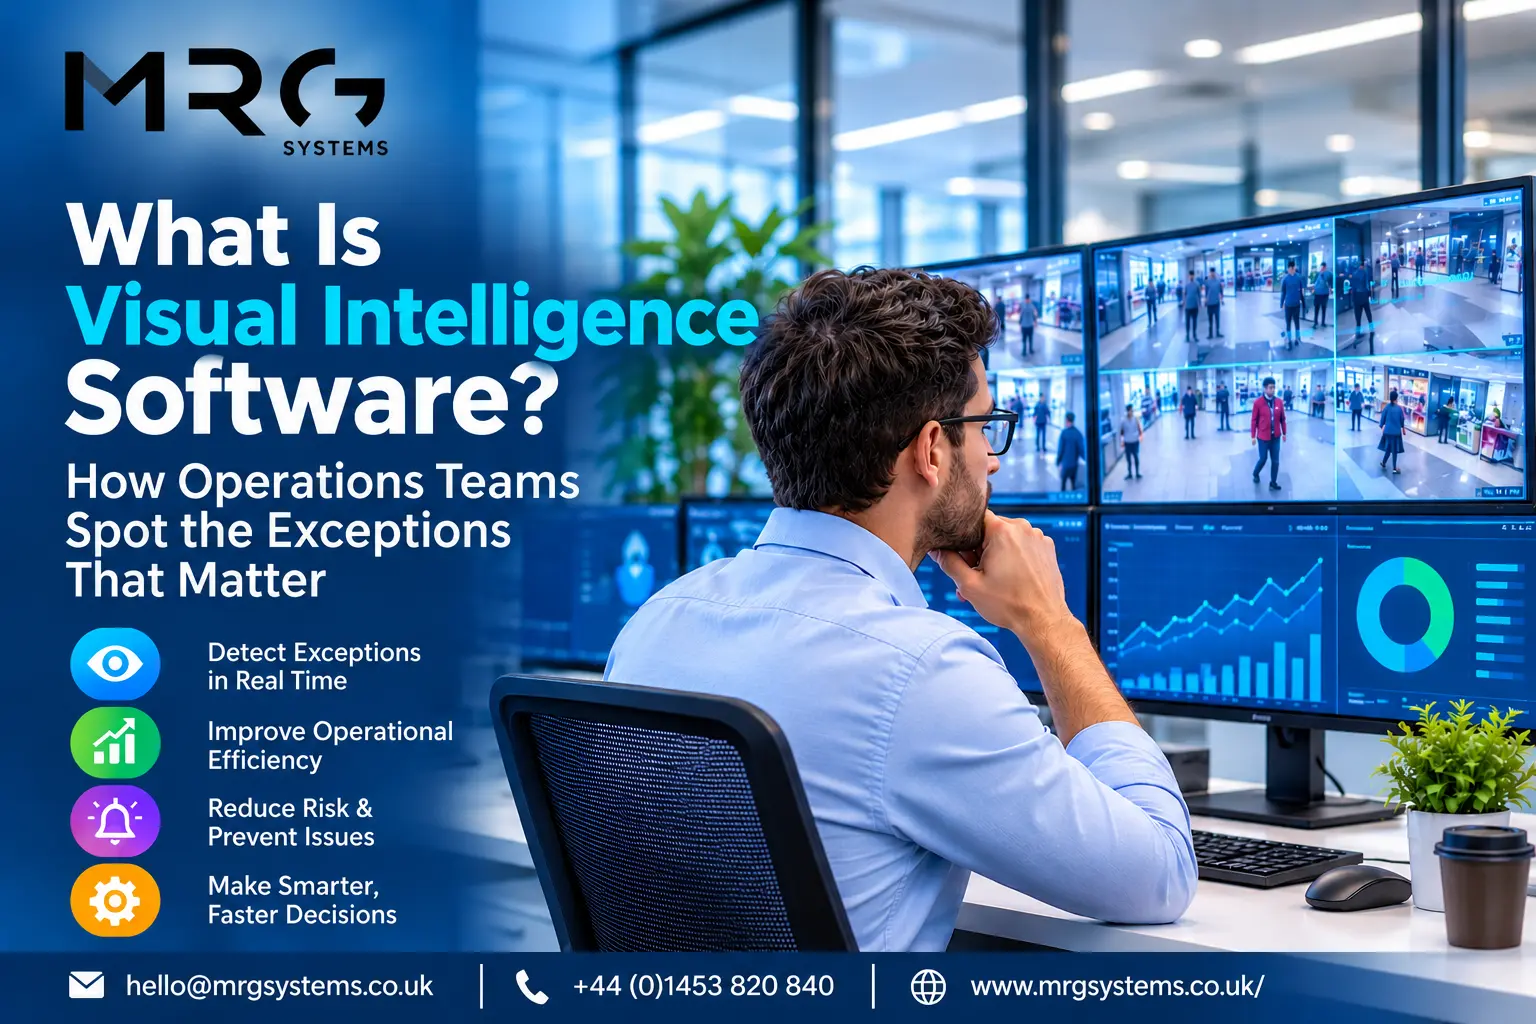
What Is Visual Intelligence Software? How Operations Teams Spot the Exceptions That Matter
Most operations teams are not short of data. They are short of attention. The numbers that would flag a stalled line, a late trunk departure, or a picking rate sliding off target already exist somewhere in the ERP, the WMS, or a spreadsheet; they are simply buried behind logins and tabs nobody opens mid shift. Visual intelligence software exists to close that gap: it puts live operational data on screens people cannot avoid, and makes the exceptions impossible to miss.
The short answer: visual intelligence software turns live operational data into visual displays that surface problems the moment they appear. Instead of asking managers to open reports, it pushes the exceptions (the late order, the stopped line, the missed KPI) onto shared screens where teams already look, so the right people act in minutes rather than at the next meeting.
Curious what your own operation would look like on one screen? Fill in the contact form with the systems you run and we will show you what is possible.
What Is Visual Intelligence Software?
The term covers platforms that merge three older ideas: the business intelligence dashboard, the control room video wall, and digital signage. Industry commentators describe visual intelligence as the shift from fragmented reports to one unified, real time view that keeps everyone aligned, and that is a fair definition: a live visual layer over your existing systems, shown where the work happens. Visual intelligence for operations differs from classic BI in one important way: it is built for glancing, not analysing. A supervisor three metres away should read the state of the shift in two seconds.
Management by Exception: Seeing Only What Needs You
A wall of green tells you nothing you need to act on, and that is the point. A management by exception dashboard stays calm until a threshold breaks, then makes the breach loud: the late order turns amber, the stalled line turns red, everything else stays quiet. Exception-based reporting flips the old model on its head; instead of reading a hundred rows to find three problems, the three problems come to you.
The classic failure is the opposite: a wall screen showing a forty row table in ten point text. Nobody reads a spreadsheet from five metres. If everything on the screen is always there, the screen becomes wallpaper within a fortnight.
How to Spot Operational Exceptions in Real Time
Three ingredients, in order. First, agree what normal looks like: a target rate, a latest departure time, a maximum queue. Second, connect the live source, so the screen reads reality rather than yesterday’s export. Third, design the visual states: calm when on plan, unmistakable when not, with a named owner for every alert. A real-time operational dashboard built this way changes behaviour, because nobody wants to own the red tile. An operational visibility software rollout that skips the ownership step just decorates the wall.
From Dashboards Nobody Opens to Screens Nobody Can Miss
BI tools answer deep questions for analysts; they were never designed for the warehouse floor. The gap shows in usage: dashboards live behind logins, and logins lose to gravity on a busy shift. Putting digital signage for operational data in the line of sight removes the login entirely. Real-time KPI screens for factories and depots work precisely because they are ambient; the number is simply there, all shift, for everyone, which makes performance a shared fact rather than a manager’s secret.
This is also where real-time data visualisation for operations differs from a monthly report pack: the feedback loop shrinks from weeks to minutes, and corrections happen inside the same shift that caused the problem.
If your team finds out about yesterday’s problems tomorrow, send us a note through the form and we will map what one live screen could change.
Where It Works: Factories, Warehouses, Control Rooms
An operational dashboard for manufacturing typically tracks line rate, downtime, quality holds, and safety days, positioned at the line and in the canteen. A warehouse performance dashboard leans on picks per hour, order cut off countdowns, and vehicle turnaround, mounted where pickers and loaders actually pass. Control room display software serves the opposite environment: fewer people and more sources, where operators need many systems merged onto video walls with alerting that escalates rather than decorates. Transport hubs, utilities, and service desks each follow one of these three patterns, and all of them are real-time data visualisation for operations rather than decoration.
Run a factory, warehouse or control room? Tell us through the form which pattern matches yours and we will send back a realistic starting point.
Connecting Your Data: ERP, BI, and Everything Else
The practical question is always integration. You should be able to connect ERP and BI data to one screen alongside spreadsheets, web feeds, and sensor outputs, without replacing any of them. That is how we designed LiveSpace: any source of data driving any number of screens, so the platform bends around your systems rather than the reverse. Visual intelligence for operations succeeds or fails on this point; software that only shows its own data simply adds another silo, this time on the wall.
Where MRG Systems Fits
MRG Systems is a UK digital signage and display systems company based in Stonehouse, Gloucestershire, building data driven screens since 1983 for organisations ranging from retailers to the BBC and the Houses of Parliament. We build each bespoke operational dashboard around the client’s own data and sight lines rather than selling a fixed template, and as digital signage dashboard software UK businesses can buy with local support, LiveSpace comes with a development team you can actually ring. See how we work, the transport and logistics and corporate office environments we serve, and the results in our case studies.
Frequently Asked Questions
Is visual intelligence the same as business intelligence?
No. BI answers deep questions for analysts at desks; visual intelligence answers one question for everyone in the building: are we on plan right now? The two work best together, with BI feeding the screens. Exception-based reporting is the bridge: BI finds the thresholds, and the screens enforce attention on them.
Do we need to replace our existing systems?
No. The whole approach sits on top of what you run today. If a system can export, publish, or be queried, its data can reach a screen, and most projects start by connecting one or two sources that already matter. A real-time operational dashboard should be an overlay, never a migration.
What belongs on the screen, and what does not?
Fewer things than most first drafts include. A useful rule from management by exception dashboard design: every element must either change behaviour or come off. Three to six live metrics, clear states, and one owner per alert beat a dense grid every time. If a number never goes red, it is decoration.
What hardware do we need on a factory floor?
Commercial screens rated for long running hours, bright enough for the position, sometimes in protective housings for dust or temperature. The hardware is rarely the hard part; operational visibility software choices and data plumbing decide whether the project works. We supply and install both, which keeps one team accountable.
How is this different from ordinary digital signage?
Ordinary signage plays scheduled content; this reads live systems and reacts. The screen is the same physical object, which is why signage companies with real data integration experience are well placed to build it. Ours has been the data driven kind since 1983.
Operations rarely fail from a lack of data; they fail from exceptions nobody saw in time. Visual intelligence software exists to make those exceptions loud, early, and owned. Complete the short contact form and tell us which number you wish your whole team could see. That is usually the right first screen.